What Metrics Should You Track to Improve Your Options Trading?
Key takeaway
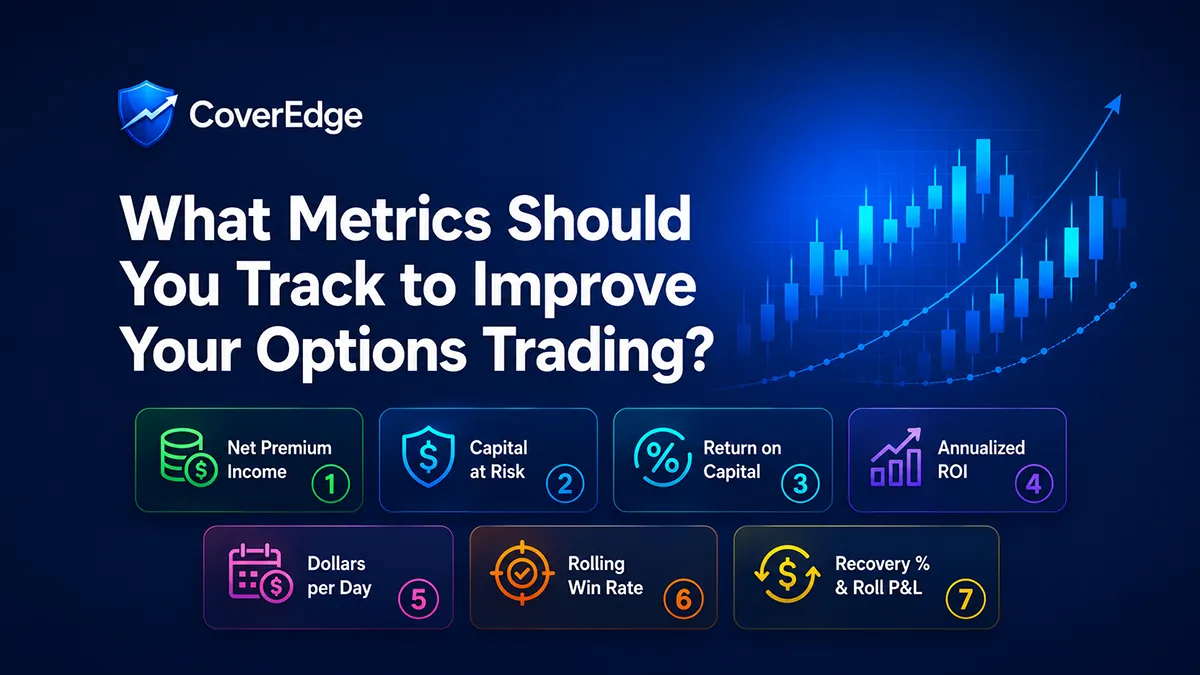
Win rate alone is a vanity metric — you can win most of your trades and still lose money to one expensive close or assignment. The metrics that actually measure options-selling performance combine income, capital, time, and lifecycle: net premium income (net of closes, rolls, and fees), capital at risk, return on capital (net income ÷ capital deployed), annualized ROI and dollars-per-day to normalize for holding period, a rolling win rate read alongside net P&L, and recovery % plus cumulative roll-chain P&L for lifecycle context. A ledger-first tracker like CoverEdge derives all of these automatically so the numbers stay consistent and net-of-fees instead of drifting in a spreadsheet.
Track your covered call & cash-secured put income with ledger-grade P&L in CoverEdge — free 14-day Pro trial, no card.
Start free trialMost options sellers track exactly one number: win rate. It feels like the scoreboard — how often the trade “worked” — but on its own it’s a vanity metric. You can win 80% of your trades and still lose money if a single assignment or an expensive buy-to-close erases months of small credits. The metrics that actually tell you whether your strategy is working combine income, capital, time, and lifecycle. Here are the seven worth tracking, what each one reveals, and what it hides.
Try the math on a real ticker — for free
Plug in any of 200+ tickers and get live premium, annualized yield, breakeven, and assignment P&L instantly. No signup, no credit card.
First, Separate Inputs From Outcomes
There’s a difference between the raw fields you record on each trade and the metrics you derive from them. If you haven’t nailed down the inputs yet — the strike, premium, cost-basis impact, and close debit for every position — start with what to track for every options trade. This guide is the next layer up: once the data is clean, these are the numbers that turn a pile of trades into a picture of performance. Every metric below is only as trustworthy as the records underneath it.
Metric 1: Net Premium Income
Your headline income number should be net, not gross. Net premium income is the premium you collected minus every buy-to-close and roll debit, minus commissions and fees. It’s tempting to add up only the credits — that number is bigger and feels better — but it’s the one that stops matching your brokerage 1099 the moment you close or roll a position. Track the net figure and you always know what you actually kept. For the full accounting routine, see how to track options premium income.
Metrics 2 & 3: Capital at Risk and Return on Capital
Income means nothing without the capital that produced it. “I made $3,000 in premium last month” is elite on $50,000 of capital and barely beats a Treasury bill on $800,000. That’s why the question under every options-income post is the same: what’s your return on capital?
Capital at risk is the money your strategy currently ties up — the cash-secured collateral behind your open puts (strike × 100 × contracts) plus the cost basis of the shares you hold. Return on capital (ROC) expresses your net premium income as a percentage of that capital, which is the only honest way to compare one approach against another. A common sanity check among premium sellers is roughly 0.5–1% of capital per week; chasing far more usually means quietly taking on far more risk — a point our study of 93 live covered call setups makes concrete: the highest-yield names paid ~3.8× the premium on ~4× the volatility.
Metrics 4 & 5: Annualized ROI and Dollars-per-Day
A 0.5% return in 7 days and a 0.5% return in 45 days are not the same trade — but they look identical until you normalize for time. Annualized ROI scales each trade’s return to a yearly basis so a weekly covered call and a monthly one can be compared on equal footing. Dollars-per-day (premium divided by days held) does the same thing in plain cash terms — it’s the metric that reveals whether your capital is actually working or just sitting in a slow position.
One caution: annualizing a very short holding period exaggerates the number. A single lucky 2-day trade can annualize to a triple-digit percentage that says nothing about your real run-rate. Use annualized figures to compare trades, not to brag — and always read them alongside the raw dollars.
Metric 6: Rolling Win Rate (In Context)
Win rate isn’t useless — it’s just incomplete. Track it over a bounded, recent window (the last 30 closed trades is a good default) so it reflects how you’re trading now, not a lifetime average that never moves. And read it next to net P&L, never alone. The trap is optimizing for the metric: endlessly rolling a losing position to avoid booking a “loss” keeps your win rate pristine while your actual results bleed. Sometimes taking assignment is the correct, higher-P&L outcome even though it dents the win column.
Metric 7: Recovery % and Roll-Chain Economics
Two lifecycle metrics matter more than they get credit for. Recovery percentage tracks how much of your original cost basis you’ve earned back through accumulated premium — for a long-term wheel position, it answers “how much of this stock have the options already paid for?” And when you roll, the number that matters isn’t the newest credit; it’s the cumulative net credit across the entire roll chain. A position rolled eight times is one economic story, not eight — track it as a single roll chain or your P&L quietly drifts.
A Simple Review Scorecard
You don’t need to stare at all seven every day. Two cadences cover it:
- Weekly — net premium collected, what’s expiring, anything that needs a roll, and any positions where the plan changed. This is the operational pass that keeps a position from aging out by accident.
- Monthly — return on capital, average income, rolling win rate paired with net P&L, recovery on your longer holds, and which positions are tying up the most capital for the least return. This is the strategic pass that tells you what to keep doing and what to cut.
How CoverEdge Calculates These For You
CoverEdge derives every one of these metrics automatically from your ledger, so you’re never maintaining a spreadsheet of formulas that drift. Because it’s ledger-first, net premium income is always net of closes, rolls, and fees; capital at risk is computed live from open-put collateral plus share basis; and the return-on-capital figure is a trailing, annualized run-rate built from your own history. The Income dashboard surfaces average weekly premium, best week, annualized ROI, dollars-per-day, and a 30-trade rolling win rate; recovery % lives on your positions and rolls.
A few honest caveats. ROC is premium-only by design — it measures the income engine and deliberately excludes unrealized gains or losses on the shares themselves, so it’s not a total-return figure. Everything is portfolio-scoped: each account is its own portfolio and the numbers are never blended into one cross-account total, which is what keeps them tax-accurate. And it’s decision-support, not advice — CoverEdge shows you clean, consistent metrics and leaves the trading call to you. Track these seven consistently and you stop guessing whether your strategy is working, because the answer is right in front of you.
Frequently asked questions
What metrics should options traders track?
Beyond win rate, track net premium income (premium collected minus buy-to-close and roll debits and fees), capital at risk (cash-secured put collateral plus share cost basis), return on capital (net income as a percentage of that capital), annualized ROI and dollars-per-day to normalize for holding period, a rolling win rate read next to net P&L, and lifecycle metrics like recovery percentage and cumulative roll-chain P&L. Together these tell you whether your strategy is actually working — income alone or win rate alone can't.
Is win rate a useful options-trading metric?
Only in context. Win rate is easy to game — endlessly rolling a losing position to avoid booking a loss keeps it pristine while your real results bleed. Track it over a bounded recent window (the last 30 closed trades is a good default) and always read it next to net P&L. A high win rate paired with negative net P&L means a few large losers are quietly outweighing many small winners.
What is return on capital for options trading?
Return on capital (ROC) expresses your net premium income as a percentage of the capital your strategy ties up — cash-secured put collateral plus the cost basis of the shares you hold. It's the only honest way to compare strategies, because the same dollar income can be excellent on a small account and mediocre on a large one. It's a comparison and risk-awareness tool, not a target to maximize; a much higher ROC usually means much higher risk.
How does CoverEdge calculate options performance metrics?
CoverEdge is ledger-first, so every metric is derived from an immutable record rather than a hand-maintained formula. Net premium income is always net of closes, rolls, and fees; capital at risk is computed live from open-put collateral plus share basis; and return on capital is a trailing annualized run-rate built from your own history. The Income dashboard surfaces average weekly premium, best week, annualized ROI, dollars-per-day, and a 30-trade rolling win rate, and each account is kept in its own portfolio so the numbers stay tax-accurate. ROC is premium-only by design — it excludes unrealized share gains and losses.
Track every premium dollar with CoverEdge
AI-enhanced research, assignment-aware roll analysis, and ledger-grade P&L that survives every roll, close, and assignment. Decision-support, not advice — you decide.
No credit card required · Cancel anytime