High Covered Call Yield Isn't Free: What 93 Live Setups Show
Key takeaway
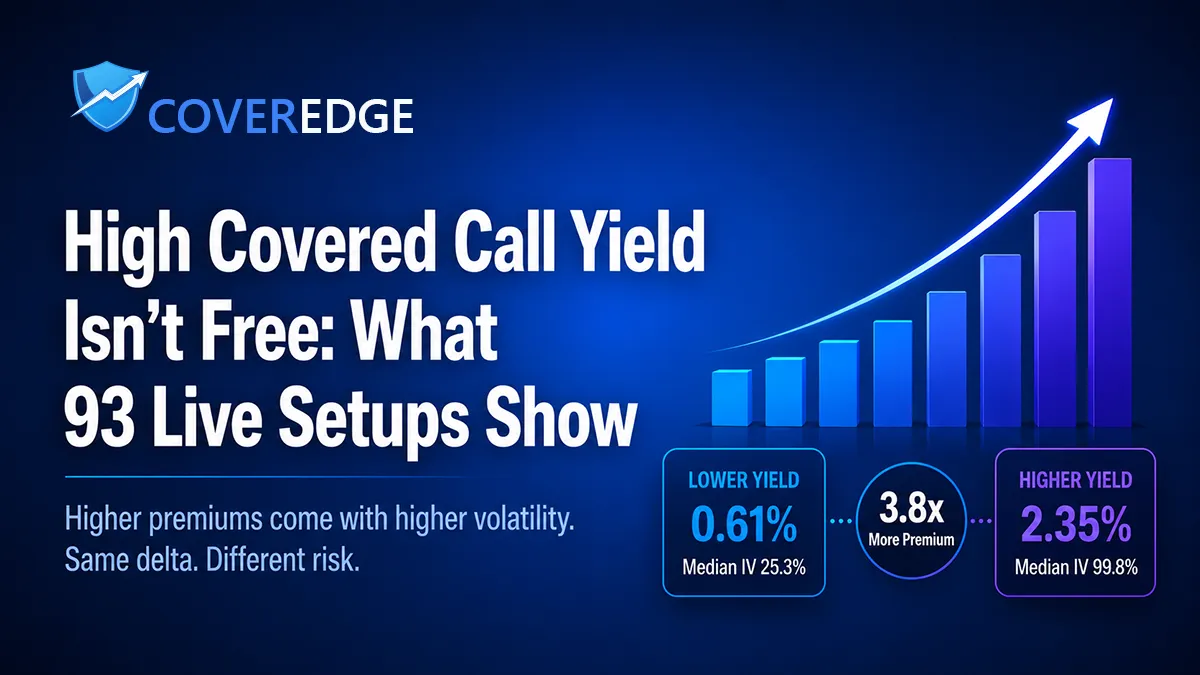
In a live snapshot of 93 covered call setups held at a comparable ~0.30 delta and 7–14 days to expiration, the highest-yielding quartile paid roughly 3.8× the premium of the lowest — but carried nearly 4× the implied volatility (median ~100% vs ~25%). Across all 93 setups, implied volatility and cycle yield had a 0.96 correlation, meaning once you control for strike and duration, covered-call yield is almost entirely a price for the stock's expected volatility, not free income. Same delta does not mean same risk: a wider premium reflects a stock the market expects to move far more, and the median ~1% weekly credit offsets only about a tenth of a 10% drop. The practical response is to size the share position first — cap per-ticker exposure and give higher-IV names a smaller cap — then judge the premium as compensation for that risk.
Track your covered call & cash-secured put income with ledger-grade P&L in CoverEdge — free 14-day Pro trial, no card.
Start free trialScroll any options-income forum and you’ll see the same reflex: the setup paying the fattest premium wins. A 2.3% weekly credit must be four times better than a 0.6% one, right? To test that instinct we took a single live snapshot of CoverEdge’s covered-call screener and held everything constant except the stock. The premium gap was real — and almost entirely a volatility price. Here’s what 93 near-identical setups actually show.
Snapshot taken July 23, 2026 at ~1:32 PM ET from CoverEdge’s live screener. A single moment in time — the exact numbers move with the market. The relationships below are the durable part.
Try the math on a real ticker — for free
Plug in any of 200+ tickers and get live premium, annualized yield, breakeven, and assignment P&L instantly. No signup, no credit card.
How We Built the Study
The goal was an apples-to-apples comparison, so we controlled for the two things that mechanically inflate yield — a closer strike and a shorter clock — and let only the underlying stock vary. Starting from CoverEdge’s curated 234-symbol public universe, we applied these filters:
- Covered calls, 7–14 days to expiration. One near-weekly cycle, so holding period is roughly constant.
- Delta 0.20–0.35, closest to 0.30. One setup per symbol at a comparable assignment probability — the strike isn’t doing the work.
- At least 50 contracts of open interest and a live two-sided quote, so every row is genuinely tradeable, not a thin-chain mirage.
- No earnings before expiration. Earnings-week IV is a different animal; we excluded any contract whose expiration crossed a report.
93 of the 234 symbols had a qualifying setup at that moment — the rest either lacked a liquid strike near 0.30 delta in that window or had earnings in the way. No user data, portfolios, or trades were touched; this is the same public data any visitor sees on the free covered call screener.
Two quick definitions so the table below reads cleanly. Cycle yield is just the premium you collect for this one ~8-day trade, as a percentage of the share price — collect $1.20 on a $60 stock and that’s a 2% cycle yield. Annualized takes that same number and stretches it out to a full year so you can line up a 7-day call against a 30-day one; it is a comparison yardstick, not a promise of what you’ll actually make.
The Headline: 3.8× the Premium, ~4× the Volatility
We sorted the 93 setups by cycle yield and split them into quartiles. The top quartile paid almost four times the premium of the bottom — but look at the implied-volatility column beside it.
| Group | Median cycle yield | Median annualized | Median IV | Median OTM buffer | Median capital / contract |
|---|---|---|---|---|---|
| Bottom-yield quartile | 0.61% | 27.9% | 25.3% | 2.3% | $13,714 |
| All 93 setups | 1.08% | 49.3% | 51.3% | 4.9% | $11,956 |
| Top-yield quartile | 2.35% | 107.0% | 99.8% | 9.8% | $4,487 |
The top quartile’s 3.8× premium advantage rode on a median implied volatility of nearly 100% — roughly four times the calm 25% of the bottom group. That’s not a coincidence you can arbitrage away. Across all 93 setups, implied volatility and cycle yield moved almost in lockstep — a correlation of 0.96 (1.0 would mean they move together perfectly). In plain terms: once you hold delta and duration fixed, a stock’s implied volatility tells you almost exactly what its covered call will pay. The yield isn’t a separate signal to hunt — it’s volatility wearing a dollar sign.
Finding 1: You’re Not Getting Paid More — You’re Getting Paid for More Risk
High premium feels like edge. Mechanically, it’s compensation. An option’s price is the market’s estimate of how far the stock might travel; a richer call simply means a wider expected move. The 0.96 IV-to-yield correlation says the screener isn’t surfacing mispriced generosity in the high-yield names — it’s surfacing volatility, faithfully priced. The premium is the fee the market pays you to absorb that risk, not a discount it’s handing you by mistake.
Finding 2: Same Delta Doesn’t Mean Same Risk
Here’s the trap that catches careful sellers. We pinned every setup near 0.30 delta, so on paper each has a similar ~70% chance of expiring out of the money. The high-yield names even carried a wider percentage buffer to their strike (9.8% vs. 2.3%). So they’re safer, right?
No — because delta describes the option, not the drawdown. A 0.30-delta call on a 25%-IV blue chip and a 0.30-delta call on a 100%-IV momentum stock can both expire worthless most of the time, yet the second one is attached to a business the market thinks could fall 15% in a week. The wider buffer exists precisely because the stock can move that far. Delta equalizes the odds of assignment; it does nothing to equalize what happens to your shares when the stock craters. That gap is the whole hidden cost.
Finding 3: The High-Yield Names Are Cheap — and Easy to Over-Concentrate
Notice the last column. The top-yield quartile tied up a median of $4,487 per contract versus $13,714 for the bottom. The richest premiums clustered in lower-priced, higher-volatility names — solar, crypto miners, speculative tech. That’s a double-edged gift: a small account can sell these, but the low sticker price makes it dangerously easy to pile three or four of them on and wake up with a portfolio that’s really one concentrated bet on high-beta risk wearing an income-strategy costume.
The Premium Cushion Is Thinner Than It Looks
The median setup across all 93 paid a 1.08% cycle credit. That’s a genuinely good weekly number — until you put it next to the risk it’s covering. Picture a $40 high-IV stock: one contract is $4,000 of shares, and that 1.08% is about $43 in premium for the week. Now the stock has a rough week and drops 10% — that’s $400 gone on your 100 shares. Your $43 of premium softened roughly a tenth of the hit; the other $357 is simply a loss. The call caps your upside and hands you a small buffer; it does not protect you from owning a stock that halves. This is the sentence worth taping to your monitor: a covered call is an income overlay on a stock position, not downside protection.
What This Means for Position Sizing
If yield is mostly a risk price, then the discipline that matters isn’t hunting the fattest premium — it’s sizing the share position underneath it so a bad week can’t sink you. Size the stock first, then evaluate the premium as compensation. A simple, mechanical way to do it:
- Set a per-ticker cap. Decide the most you’ll commit to any one underlying — say 15–20% of the options sleeve. Higher-IV names deserve a smaller cap, not a bigger one, no matter how rich the call looks.
- Covered calls: contracts =
floor(max ticker allocation ÷ (share price × 100)). On a $50 stock with a $10,000 cap, that’s two contracts — full stop, regardless of the yield. - Cash-secured puts: contracts =
floor(max cash allocation ÷ (strike × 100)), because a put reserves strike × 100 in collateral per contract. - Judge the premium last. Only after the size is fixed do you ask whether the credit is worth owning that stock through its expected move. If the answer is no, the yield was never the point.
For the metrics that tell you whether the whole book is actually working — net premium income, return on capital, and the win-rate context most sellers miss — see the seven options-trading metrics worth tracking. And if you do want the fat premiums, read how to size high-IV covered calls before you sell one.
A Checklist Before You Chase Yield
- Is the IV rich for a reason you understand? Rich premium plus an upcoming catalyst (earnings, an FDA date, a crypto move) is the market pricing a real event, not free money.
- Would you hold the shares through the expected move? If a 15% drop would make you panic-sell, the premium won’t save you — size down or skip it.
- How much of your book is high-beta? Three cheap high-IV names can quietly become one giant correlated position. Check concentration before adding a fourth.
- Are you picking the strike, or is the yield picking it for you? Anchor on a delta and a business you’re comfortable with; let the credit be the output. Our strike-selection framework walks through it.
How CoverEdge Helps You See the Trade-Off
This whole study is just CoverEdge’s public data read through one consistent lens — and the product is built to keep that lens in front of you at decision time. The free covered call calculator shows the premium, breakeven, and capital at risk side by side for any setup, so the yield never appears without the capital it rests on. The screener ranks setups by annualized yield × probability of expiring out of the money — not raw yield — so the most dangerous lottery tickets don’t float to the top.
Inside the app, CoverEdge tracks capital at risk across your whole portfolio and derives return on capital from a ledger-first record, so you can see whether a sleeve of high-yield names is actually out-earning the risk it carries or just adding volatility to your equity curve. It’s decision-support, not advice — the sizing call stays yours. But the numbers will always show you the cost sitting behind the yield, which is the entire point: high covered-call yield isn’t free — it’s priced.
For a live example of this trade-off, our weekly Monday Screen runs the same public universe through the ranking engine and shows the strike cushion, collateral, and assignment math next to every headline yield.
Frequently asked questions
What is a good covered call yield?
There's no single 'good' number, because yield is mostly a function of the underlying stock's implied volatility. In a live 93-setup snapshot at a comparable ~0.30 delta and 7–14 days to expiration, the median weekly (cycle) credit was about 1.08% of the share price, with a low-volatility quartile near 0.6% and a high-volatility quartile near 2.35%. A higher yield isn't automatically better — it almost always means the market expects the stock to move more, so judge the credit against the risk of holding that specific stock rather than against other tickers.
Why do some covered calls pay so much more premium?
Implied volatility. An option's price reflects how far the market expects the stock to move, so a stock with 100% implied volatility pays far richer call premium than one at 25% — even at the same delta and expiration. In our snapshot, implied volatility and cycle yield had a 0.96 correlation, meaning the premium difference between a high-yield and a low-yield covered call is overwhelmingly explained by volatility, not by one setup being a better deal than another.
Does selling a 0.30-delta call control my risk?
Only the assignment risk, not the downside. Delta approximates the probability the call finishes in the money — a 0.30-delta call has roughly a 70% chance of expiring worthless regardless of the underlying. But it says nothing about how far the stock can fall. A 0.30-delta call on a calm blue chip and one on a 100%-IV momentum name have similar assignment odds and wildly different drawdown risk. To control that, you size the share position, not just pick a delta.
How do I size a covered call position?
Size the underlying stock first, then evaluate the premium. Set a maximum you'll commit to any one ticker (many sellers use 15–20% of their options sleeve, with a smaller cap for higher-volatility names), then take contracts = floor(max ticker allocation ÷ (share price × 100)). For a cash-secured put, it's floor(max cash allocation ÷ (strike × 100)) because each contract reserves strike × 100 in collateral. Only after the size is fixed do you ask whether the credit is worth owning that stock through its expected move.
Track every premium dollar with CoverEdge
AI-enhanced research, assignment-aware roll analysis, and ledger-grade P&L that survives every roll, close, and assignment. Decision-support, not advice — you decide.
No credit card required · Cancel anytime