CoverEdge Monday Screen: Options Setups for August 31, 2026
Key takeaway
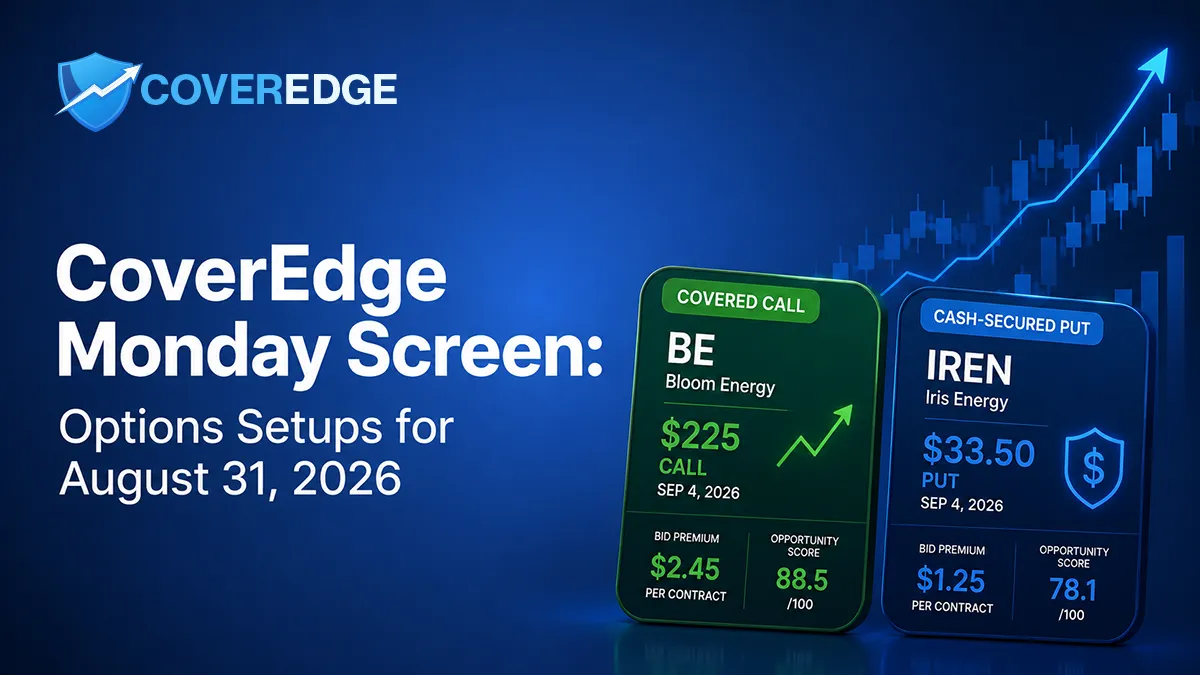
The CoverEdge Monday Screen is a weekly, public illustration of our options-income ranking engine, run on a fixed list of liquid stocks and ETFs and frozen at a single timestamped snapshot — it never reads any user portfolio or watchlist. For August 31, 2026 the screen surfaced a Bloom Energy (BE) September 4 $225 covered call (a hypothetical that assumes you already own 100 shares; $245 credit, strike 9.6% out of the money, Opportunity Score 83.5) and an Iris Energy (IREN) September 4 $33.50 cash-secured put ($28 credit on $3,350 of reserved collateral, effective cost basis $33.22, Opportunity Score 77.6). Both pay well because they are high-implied-volatility names, so the premium is compensation for real downside and assignment risk, not a free yield — the annualized figures are comparison yardsticks, not forecasts. This is educational commentary on public data, not investment advice or a recommendation.
Track your covered call & cash-secured put income with ledger-grade P&L in CoverEdge — free 14-day Pro trial, no card.
Start free trialWelcome to the CoverEdge Monday Screen — a weekly, public look at what our options-income ranking engine surfaces from a fixed list of liquid stocks and ETFs. Each edition freezes a single mid-day market snapshot, runs the same screen anyone can run on our free tools, and walks through one covered call and one cash-secured put in detail. This is educational commentary on public data, not a recommendation, a signal service, or a peek at anyone's portfolio.
Snapshot taken Monday, August 31, 2026 at ~1:53 PM ET; the underlying option chains were refreshed around 1:50 PM ET from CoverEdge's live market-data cache. Every price, premium, and score below is frozen at that moment and will have moved by the time you read this. Nothing here is investment advice or a recommendation to buy, sell, or hold any security — you make your own decisions.
Try the math on a real ticker — for free
Plug in any of 200+ tickers and get live premium, annualized yield, breakeven, and assignment P&L instantly. No signup, no credit card.
How This Screen Works
The Monday Screen is deliberately mechanical and public. It reads the exact same ranked data as our free covered call screener and cash-secured put screener — a curated universe of the most actively traded US stocks and ETFs, scored by a 0–100 Opportunity Score that blends conservatively-executable (bid-based) income, assignment risk, expected-move coverage, liquidity, and duration, minus a penalty for earnings inside the contract. It never reads a portfolio, a watchlist, or any private user data, and it does not aggregate what other people are trading.
To keep every edition honest and reproducible, the screen applies one fixed, documented policy before ranking:
- A 3–9 day expiration window. Short enough to be a genuine weekly setup, long enough to reach the next standard Friday expiration.
- A strict liquidity bar. Open interest of at least 250 contracts, a positive executable bid, and a bid/ask spread no wider than 10% of the mid — tighter than the bar we use for symbols you personally follow, because these are unfamiliar names.
- Same-session data only. A contract is eligible only if its option chain was refreshed in the current trading session. This edition's highest-scoring put candidate was actually a QQQ contract — we skipped it because its chain data was stale, even though its underlying quote was current. A “same-day” snapshot has to actually be same-day.
- One call, one put, distinct symbols. We prefer to show one of each on two different underlyings. We never force a weak contract through the gate to fill a slot; if only one strategy clears the bar, we'd show two of it, and if nothing clears, we publish nothing that week.
With that settled, here is what cleared the screen this Monday.
The Covered Call: BE (Bloom Energy)
The top-ranked covered call in the window was a Bloom Energy (BE) September 4, 2026 $225 call, with the stock at $205.31 at snapshot time. Remember the mechanics: a covered call is a hypothetical here. You would only write this if you already owned 100 shares of BE per contract — the screen has no idea whether you do, and buying 100 shares purely to sell one call is a different (and much larger) decision than the option itself.
| Field | Value at snapshot |
|---|---|
| Underlying price | $205.31 |
| Strike / expiration | $225 call · Sep 4, 2026 (4 DTE) |
| Bid / ask | $2.45 / $2.50 (spread 2.0% of mid) |
| Premium collected (bid) | $245 per contract |
| Strike cushion (out-of-the-money) | 9.59% above the stock |
| Delta / implied volatility | 0.20 / ~100% |
| Open interest / volume | 1,203 / 776 |
| Period return on share value (bid) | 1.19% over 4 days |
| Annualized (comparison yardstick) | ~108.9% |
| Opportunity Score | 83.5 / 100 |
Why it scored well. The credit is conservatively measured against the bid you could actually hit, not the mid, and even so it is a 1.19% return on the share value for a four-day hold. The 0.20 delta puts the strike a healthy 9.59% above the stock, so the shares have real room to run before assignment becomes likely, and the spread is a very tight 2% of the mid on more than 1,200 contracts of open interest — this is a genuinely tradeable chain, not a thin-quote mirage. There is no earnings report inside the four-day window.
What the score doesn't say. That ~100% implied volatility is the whole story behind the rich premium — Bloom Energy is a volatile name, and the same volatility that pays you $245 is why the stock can fall far faster than the premium cushions. The annualized ~108.9% figure is a comparison yardstick for lining this up against other durations, not a return you should expect to compound; you are not going to earn 108% a year writing weekly calls, and treating that number as a forecast is the single most common way premium sellers fool themselves. If BE rallies through $225, your shares are called away and your upside is capped — the total gain in that case would be about $2,214 per contract (the $19.69 of appreciation to the strike plus the $2.45 premium), or roughly 10.8% on the share cost, and you miss anything above $225.
The Cash-Secured Put: IREN (Iris Energy)
On the put side, the highest-ranked contract that cleared the same-session freshness check was an Iris Energy (IREN) September 4, 2026 $33.50 put, with the stock at $36.56. A cash-secured put means you set aside the full cash to buy the shares if assigned, collect the premium up front, and agree to buy at the strike if the stock closes below it at expiration.
| Field | Value at snapshot |
|---|---|
| Underlying price | $36.56 |
| Strike / expiration | $33.50 put · Sep 4, 2026 (4 DTE) |
| Bid / ask | $0.28 / $0.30 (spread 6.9% of mid) |
| Premium collected (bid) | $28 per contract |
| Cash collateral required | $3,350 per contract |
| Effective cost basis if assigned | $33.22 per share |
| Strike cushion (out-of-the-money) | 8.37% below the stock |
| Delta / implied volatility | 0.15 / ~85% |
| Open interest / volume | 638 / 1,504 |
| Period return on collateral (bid) | 0.84% over 4 days |
| Annualized (comparison yardstick) | ~76.3% |
| Opportunity Score | 77.6 / 100 |
Why it scored well. The strike sits 8.37% below the current price, so the stock can drift down meaningfully and the put still expires worthless. If it is assigned, your effective cost basis is the strike minus the premium — $33.50 − $0.28 = $33.22 — which is about 9.1% below where the stock traded at snapshot time. The 0.84% four-day return is measured against the full $3,350 of collateral, which is the honest denominator for a cash-secured put: the whole point is that the cash is genuinely reserved.
What the score doesn't say. Iris Energy is a small, high-volatility stock, and the ~85% implied volatility is why a strike 8% out of the money still pays anything at all. The put's spread is 6.9% of the mid — inside our 10% bar, but noticeably wider than the BE call, so a limit order matters more here. And the real risk is not the $28: it is that a stock this volatile can gap well below $33.22, at which point you own shares at a loss regardless of the premium. A cash-secured put is only comfortable on a stock you would genuinely be happy to own at the strike.
Reading the Two Side by Side
Both contracts scored in the same neighborhood, but they are not the same trade. The BE call is an income overlay on shares you'd already own — it does nothing to protect the downside on the stock and caps your upside in exchange for the premium. The IREN put is a “get paid to set a buy limit” trade — your risk is being assigned shares in a fast-falling stock, and your reward is a modest credit plus a lower entry if you wanted the shares anyway. In both cases the premium is compensation for taking on a real, specific risk, not a free yield. That is the entire reason we show the strike cushion, the collateral, and the assignment math next to the headline return: the number that sells is never the number that matters most.
It is also worth seeing how quickly this ages. Four days to expiration means both of these contracts either expire or need a decision by Friday, and the underlying prices, premiums, and scores were already drifting while this was being written. That is exactly why the screen freezes a timestamp instead of pretending the numbers are current. If you want to see where these names stand right now, the live tools will show today's data, not this snapshot's.
Run the Screen Yourself
Everything above came from public data you can pull in a few clicks. The free covered call screener and cash-secured put screener rank live setups across the same universe, and each per-ticker covered call calculator shows premium, breakeven, downside buffer, and assignment outcome side by side so a yield never appears without the capital and risk sitting right behind it. If you want the deeper background on why a fat premium is usually a volatility price rather than a free lunch, our study of 93 covered call setups makes the relationship explicit, and turning a screener row into a tracked trade walks the full workflow.
Inside the app, CoverEdge tracks every covered call and cash-secured put through its full lifecycle — open, roll, assign, expire, or close — on a ledger-first accounting model, so your real cost basis, realized P&L, and capital at risk stay accurate no matter how many times a position is rolled or assigned. The Monday Screen is a public illustration of the ranking engine that powers that workflow. It is educational commentary on public market data, it does not know or use anything about your account, and it is never a recommendation to place any specific trade. You decide.
Frequently asked questions
What is the CoverEdge Monday Screen?
It's a weekly, public blog series that runs a fixed universe of liquid stocks and ETFs through the same 0–100 Opportunity Score that powers CoverEdge's free screeners, then freezes a single timestamped market snapshot and walks through one covered call and one cash-secured put in detail. It never reads any user's portfolio, watchlist, or preferences, and it is educational commentary on public data — not a recommendation, signal service, or personalized advice.
How are the setups chosen?
Mechanically and publicly. The screen filters to a 3–9 day expiration window, requires at least 250 contracts of open interest, a positive executable bid, and a bid/ask spread no wider than 10% of the mid, and only accepts contracts whose option chain refreshed in the current trading session. It then ranks by the canonical Opportunity Score and prefers one covered call and one cash-secured put on distinct symbols. It never lowers the bar to fill a slot — if nothing qualifies, nothing is published.
Are these numbers still accurate?
No. Every price, premium, delta, and score in the post is frozen at the August 31, 2026 ~1:53 PM ET snapshot and will have moved since. The contracts shown had just four days to expiration, so they expired or required a decision within the same week. For current data, use the live free covered call and cash-secured put screeners — the post is a fixed historical snapshot, not a live quote.
Is a high annualized yield a good reason to take the trade?
Not on its own. The annualized figures (about 109% for the BE call and 76% for the IREN put) are comparison yardsticks that stretch a four-day return out to a full year — they are not returns you should expect to compound. Both contracts pay richly because they are high-implied-volatility stocks, which means the same volatility that funds the premium is why the underlying can move sharply against you. The premium is compensation for real risk, so weigh the strike cushion, collateral, and assignment outcome, not just the yield.
Track every premium dollar with CoverEdge
AI-enhanced research, assignment-aware roll analysis, and ledger-grade P&L that survives every roll, close, and assignment. Decision-support, not advice — you decide.
No credit card required · Cancel anytime