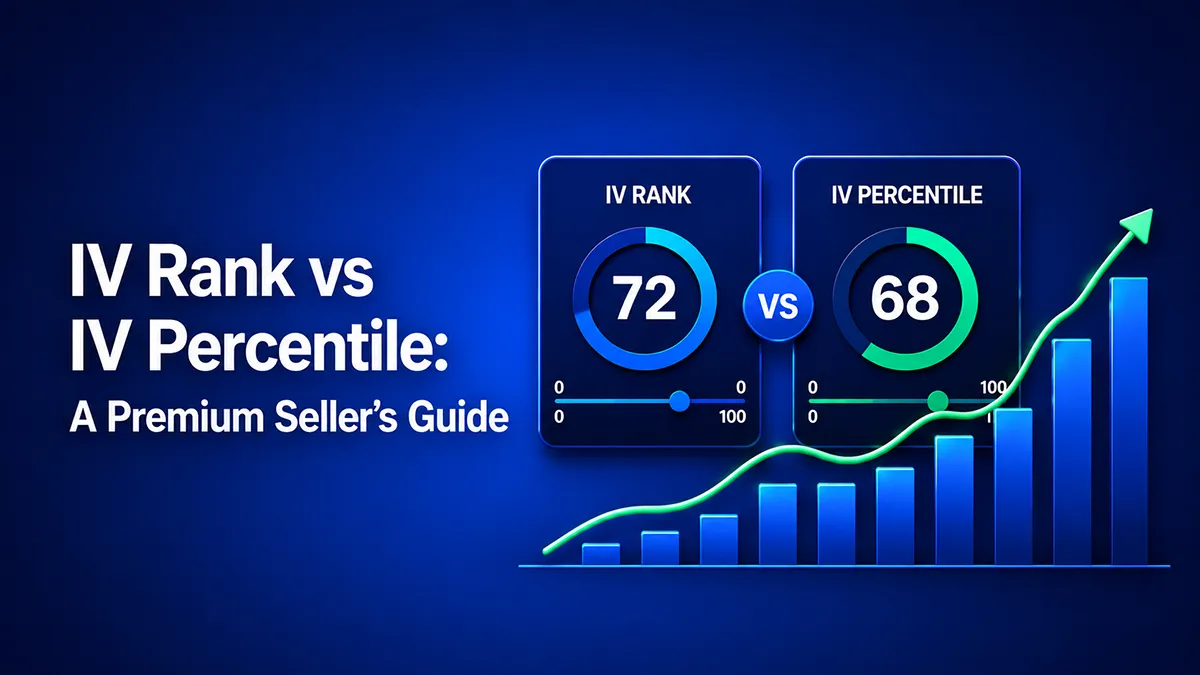
IV Rank vs IV Percentile: A Premium Seller's Guide
Key takeaway
IV rank and IV percentile both tell you whether a stock's implied volatility is high relative to its own history, but they measure it differently: IV rank compares current IV to its 52-week high-low range, while IV percentile is the share of days over the past year that IV was lower than today. IV percentile is generally steadier for week-to-week premium-selling decisions because it is less skewed by a single outlier spike. Most premium sellers look to sell when IV percentile is above 50 — richer premium relative to the stock's normal volatility — and stay selective below 30.
Track your covered call & cash-secured put income with ledger-grade P&L in CoverEdge — free 14-day Pro trial, no card.
Start free trialIV rank and IV percentile are two of the most useful — and most misunderstood — metrics for premium sellers. Both tell you whether implied volatility is "high" or "low" for a given stock, but they answer slightly different questions. Use the wrong one and you'll consistently sell premium at the wrong time. This guide explains IV rank vs IV percentile, when to use each, and how serious covered call writers turn them into actionable rules.
Try the math on a real ticker — for free
Plug in any of 200+ tickers and get live premium, annualized yield, breakeven, and assignment P&L instantly. No signup, no credit card.
The Problem with Raw IV
A stock's implied volatility number (e.g., "42% IV") tells you almost nothing in isolation. 42% IV is sky-high for KO and absurdly cheap for TSLA. To make IV useful, you have to normalize it against the stock's own history — and that's what IV rank and IV percentile do.
What Is IV Rank?
IV rank measures where today's implied volatility sits between the lowest and highest IV the stock has seen over the last 52 weeks. The formula:
IV Rank = (Current IV − 52-week Low IV) / (52-week High IV − 52-week Low IV) × 100IV rank is a number from 0 to 100. An IV rank of 75 means current IV is 75% of the way from the 52-week low to the 52-week high. It answers: "How extreme is today's IV relative to this stock's 52-week range?"
What Is IV Percentile?
IV percentile measures the percentage of trading days over the last 252 trading days (a year) on which IV was below today's level. The formula:
IV Percentile = (Days with IV below current IV / Total trading days) × 100An IV percentile of 75 means current IV is higher than it was on 75% of trading days last year. It answers: "How often does this stock's IV reach today's level?"
IV Rank vs IV Percentile: The Key Difference
The two metrics often agree, but when they disagree, that's information. Imagine a stock that spent 11 months at 20% IV, then had a single freak event push it to 80% IV, and is now back at 30% IV.
- IV rank ≈ 17 (30 is 17% of the way from 20 to 80) → looks like IV is cheap.
- IV percentile ≈ 90 (30% IV was higher than IV on 90% of days) → looks like IV is rich.
Which is right? IV percentile, in this case. One outlier shouldn't anchor your sense of "normal" for the next year. IV rank is more sensitive to outliers; IV percentile is more sensitive to the typical day. This is why most serious premium sellers default to IV percentile.
When to Use IV Rank vs IV Percentile
| Situation | Better metric | Why |
|---|---|---|
| Stable, range-bound stocks (KO, JNJ) | Either | Both metrics agree closely |
| Stocks with a recent volatility spike | IV Percentile | Doesn't get anchored by one extreme day |
| Comparing across underlyings | IV Percentile | Normalizes by frequency, not raw range |
| Stocks with a long volatility decline | IV Rank | Captures the "cheap end of a multi-year range" |
How Premium Sellers Actually Use These Metrics
The general rule across the income-options community:
- Sell premium when IV percentile > 50. You're collecting more premium than the stock has paid you on 50%+ of the trading days in the past year.
- Aggressively sell premium when IV percentile > 70. This is the sweet spot — vol is rich, theta will likely decay back toward the mean, and you're paid for the risk.
- Avoid selling premium when IV percentile < 30. The premium isn't paying you for the assignment risk you're taking. Wait, or use a different strategy.
Combine this with the strike-selection framework from our strike price guide, and you have a complete entry system: high IV percentile + 0.30 delta short call + 30–45 DTE.
Common Mistakes
- Comparing raw IV between stocks. A 30% IV on JNJ is not the same trade as a 30% IV on PLTR. Always normalize.
- Selling premium at IV percentile 10 just because it's "a good stock." Quality matters, but if vol is dead, premium is unattractive on any name.
- Ignoring earnings. IV percentile spikes ahead of earnings for predictable reasons. That spike isn't a free-money signal — it's priced for an event. See our take on covered calls around earnings.
- Treating IV rank/percentile as a stand-alone signal. They're a filter, not a thesis. The underlying still needs to be a stock you want to own at the strike.
Where to Find IV Rank and IV Percentile
Most professional platforms (tastytrade, ThinkOrSwim, OptionStrat) display both. Inside CoverEdge, the research tab surfaces IV percentile alongside delta, DTE, and bid/ask spread for every contract — so you can filter your candidate trades by IV percentile in one click instead of cross-referencing three tools. The AI-powered research recommendations also use IV percentile as one of the inputs when ranking covered call opportunities.
Related Reading
Put IV percentile to work with our ranked list of the best high-IV stocks for covered calls, then pair it with the strike-selection framework for a complete entry system: high IV percentile + 0.30 delta + 30–45 DTE.
Frequently asked questions
Is IV rank or IV percentile more reliable?
IV percentile is generally more reliable for premium-selling decisions because it is less sensitive to single outlier days. IV rank can be useful for catching long-term lows, but for week-to-week trading IV percentile gives a steadier signal.
What IV percentile should I sell covered calls at?
Most experienced premium sellers target an IV percentile of 50 or higher. Below 30, the premium usually is not worth the assignment risk. Between 30 and 50, be selective. Above 70, the risk-reward is most favorable for short-premium strategies.
Does high IV mean a stock is going to move?
No. High implied volatility means the market expects a large move — it does not guarantee one. About 60% of the time, realized volatility comes in below implied volatility, which is exactly why systematic premium selling has positive expectancy over large samples.
How is IV rank different from the VIX?
The VIX measures the implied volatility of S&P 500 options. IV rank measures the implied volatility of a single stock's options relative to its own 52-week range. The VIX tells you about the market; IV rank tells you about one ticker.
Track every premium dollar with CoverEdge
AI-enhanced research, assignment-aware roll analysis, and ledger-grade P&L that survives every roll, close, and assignment. Decision-support, not advice — you decide.
No credit card required · Cancel anytime